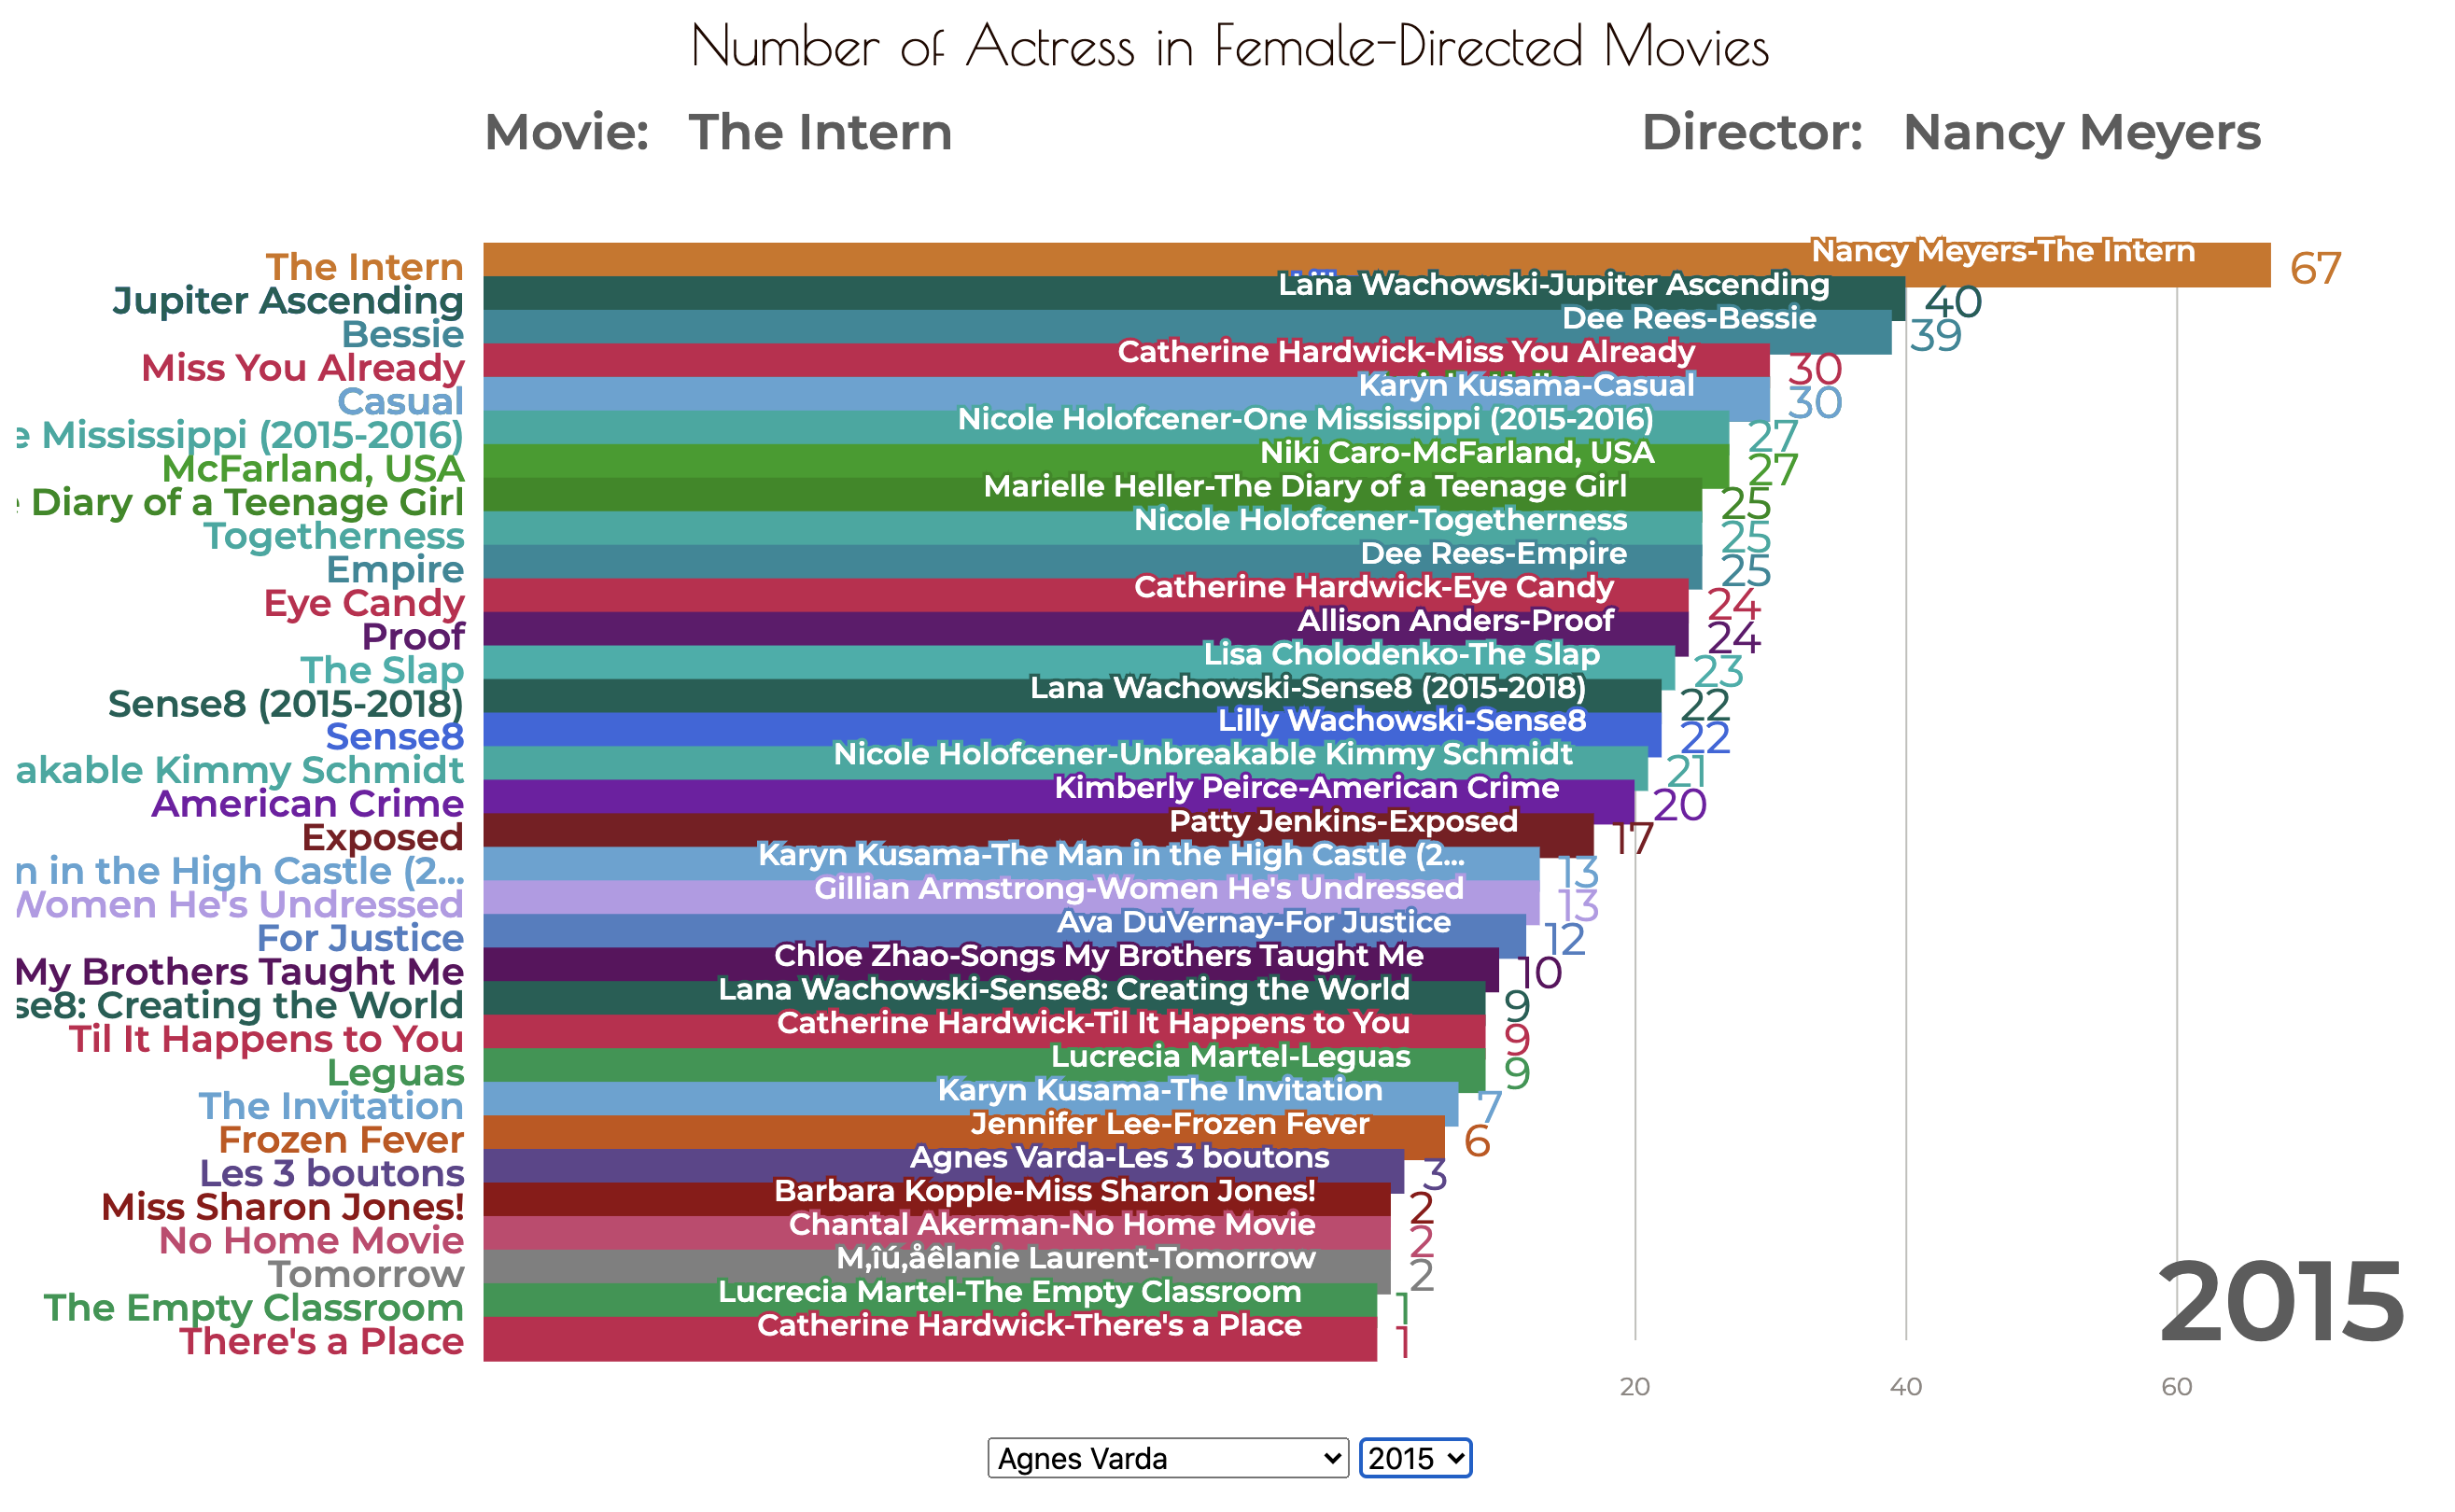
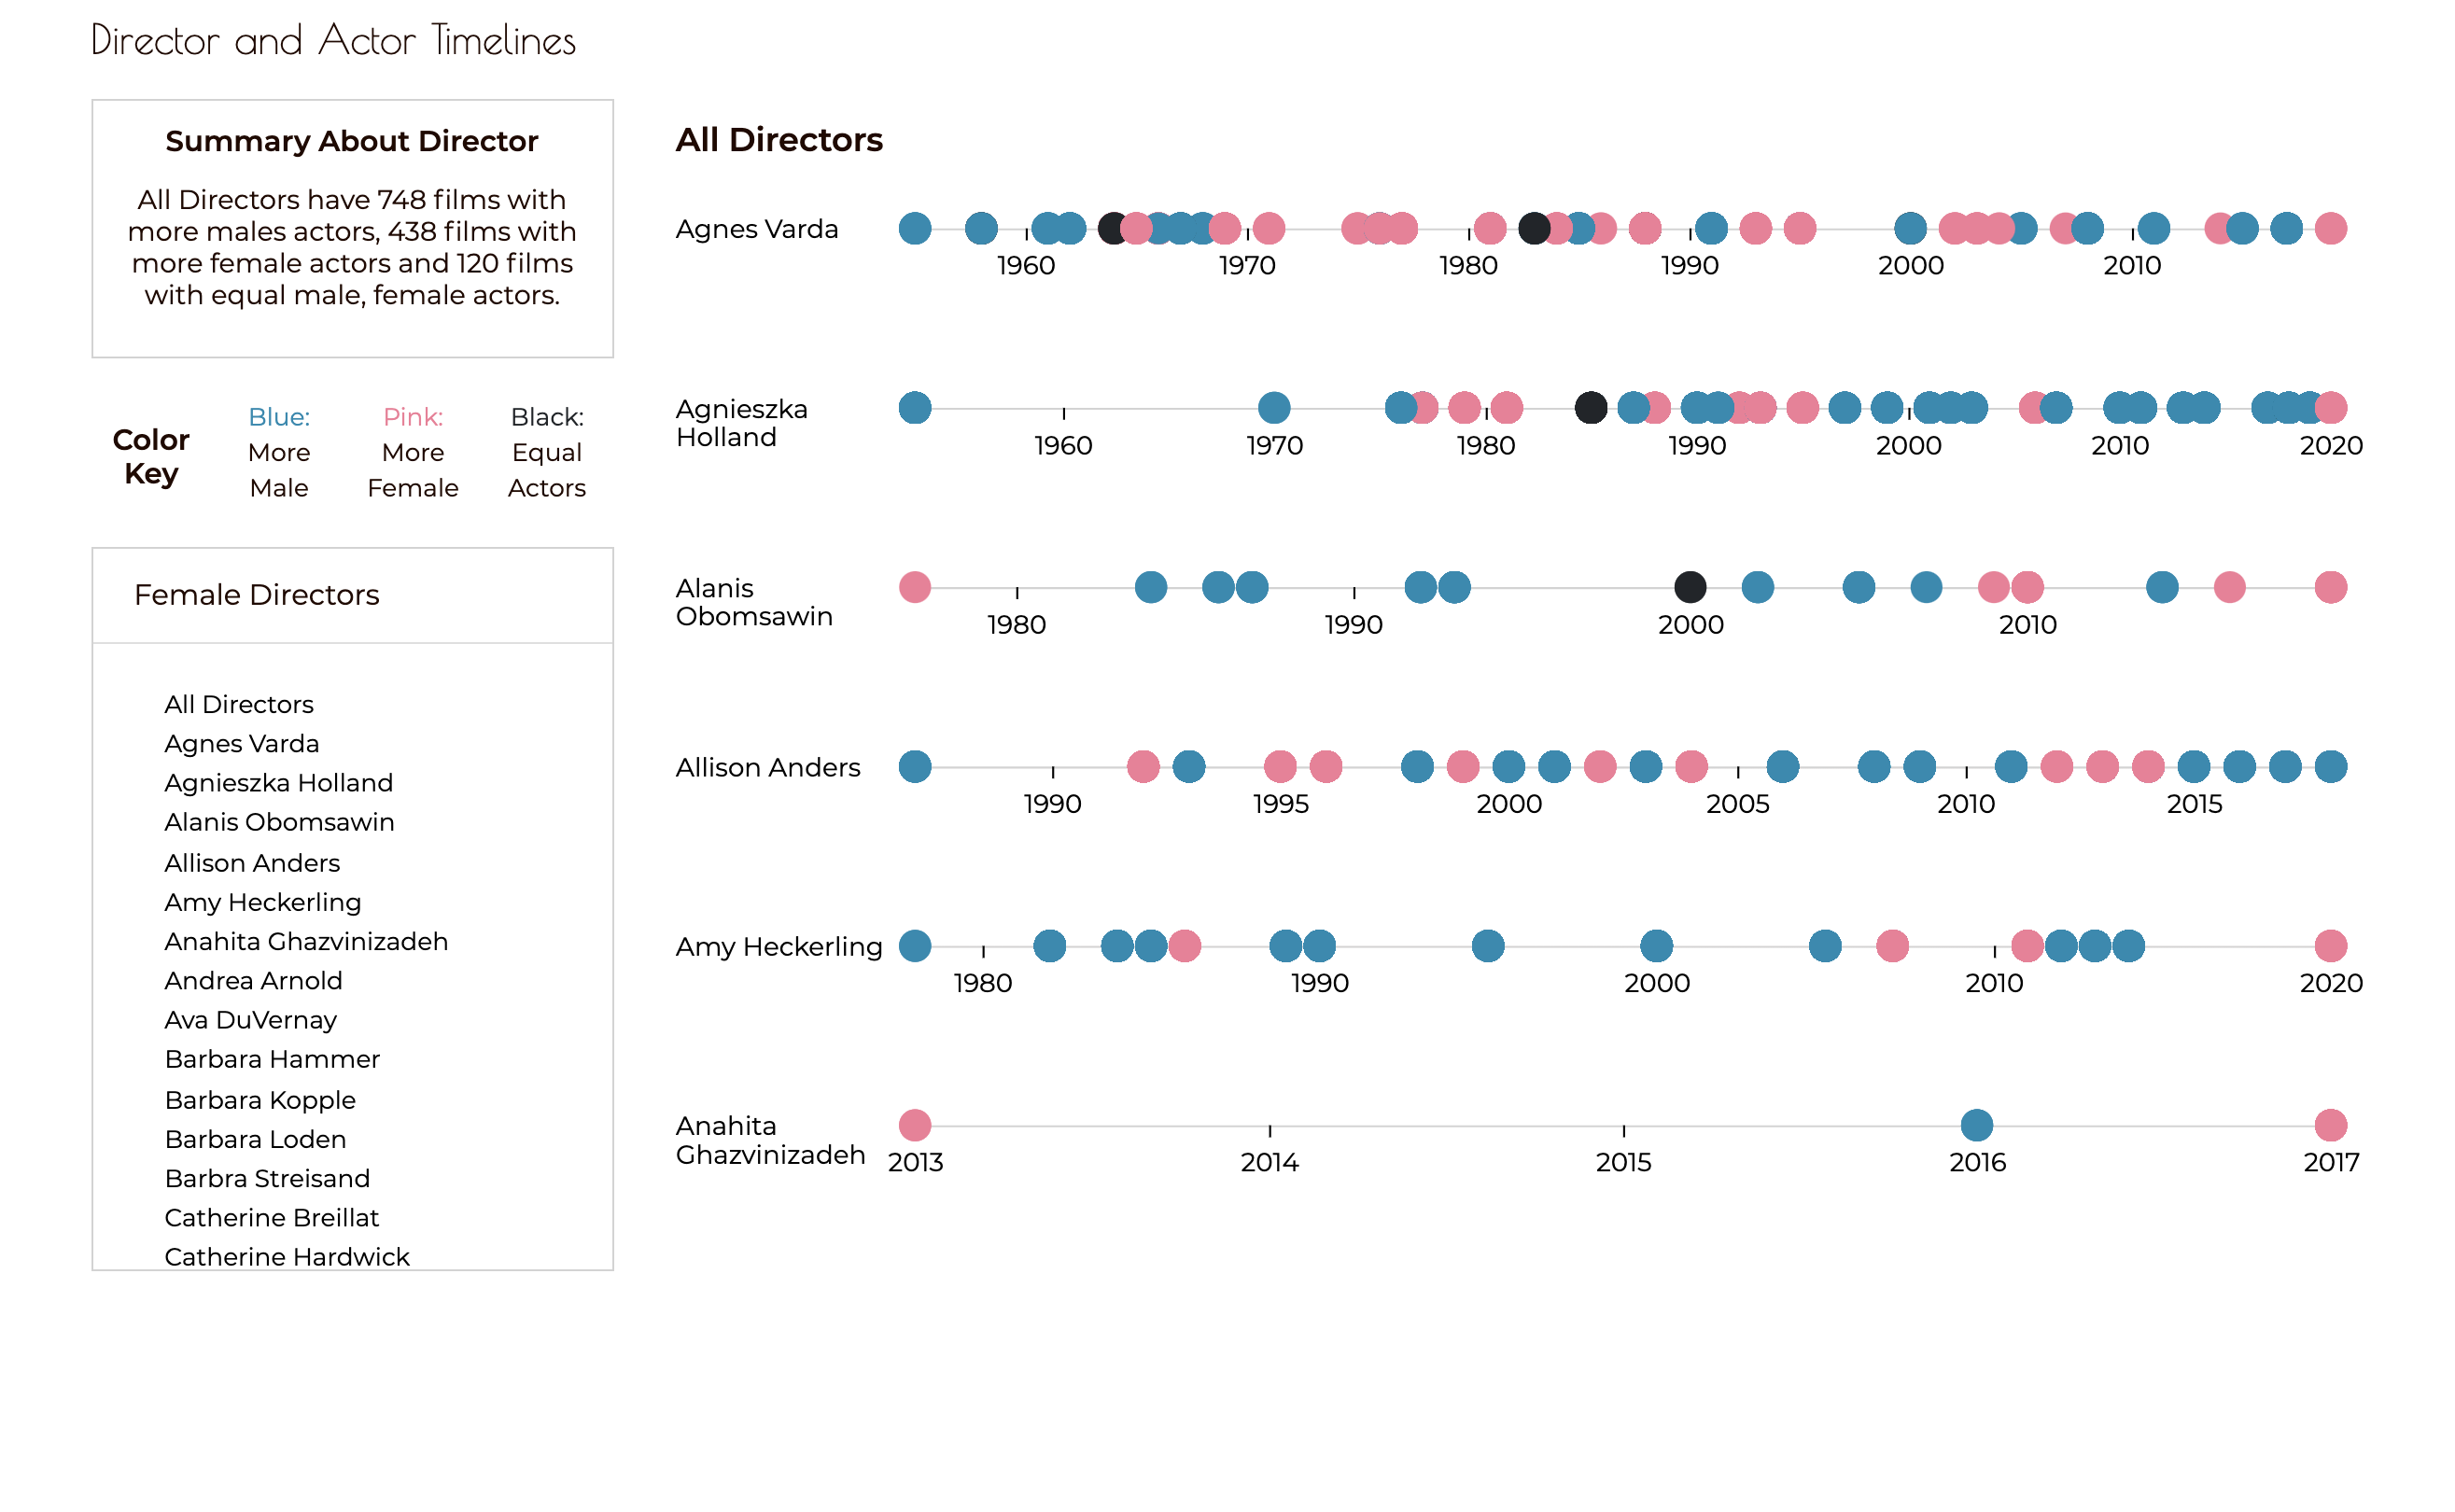
Our D3 Visualizations display analyses focused on gender differences over time, per director and per media as well as actor director relations.
This visualization shows how the number of actresses in female directed movies are ranked. Futhermore, it presents an animated view of actresses over time and how female directors gave more chances to actresses in the past 100 years.
This visualization focuses on gender differences, male and female actors, in female directed movies. It gives a compact, direct line picture of how these genders vary in each director's films.
This visualization focuses on gender differences, male and female actors, in each individual female directed movie. It gives a side by side animated visual of how these genders vary in each film and provides a ratio as well.
This visualization focuses reoccuring actors that each female director has worked with to gauge the gender differences and amount of recurrences. It gives a collected bubble view to observe all of the actors.
This visualization focuses on actors who have worked with more than one female director. It shows network graphs that show the female directors and corresponding media that they directed where the actor participated in.
This visualization provides timelines of the female directors and actors who have worked with them. It shows a compact view of timelines which are colored coordinated based on films with higher male actors, higher female actors or equal amount of actors per gender.